About the University Endowment

Endowment Value: $1,668,622,000

as of June 30, 2025

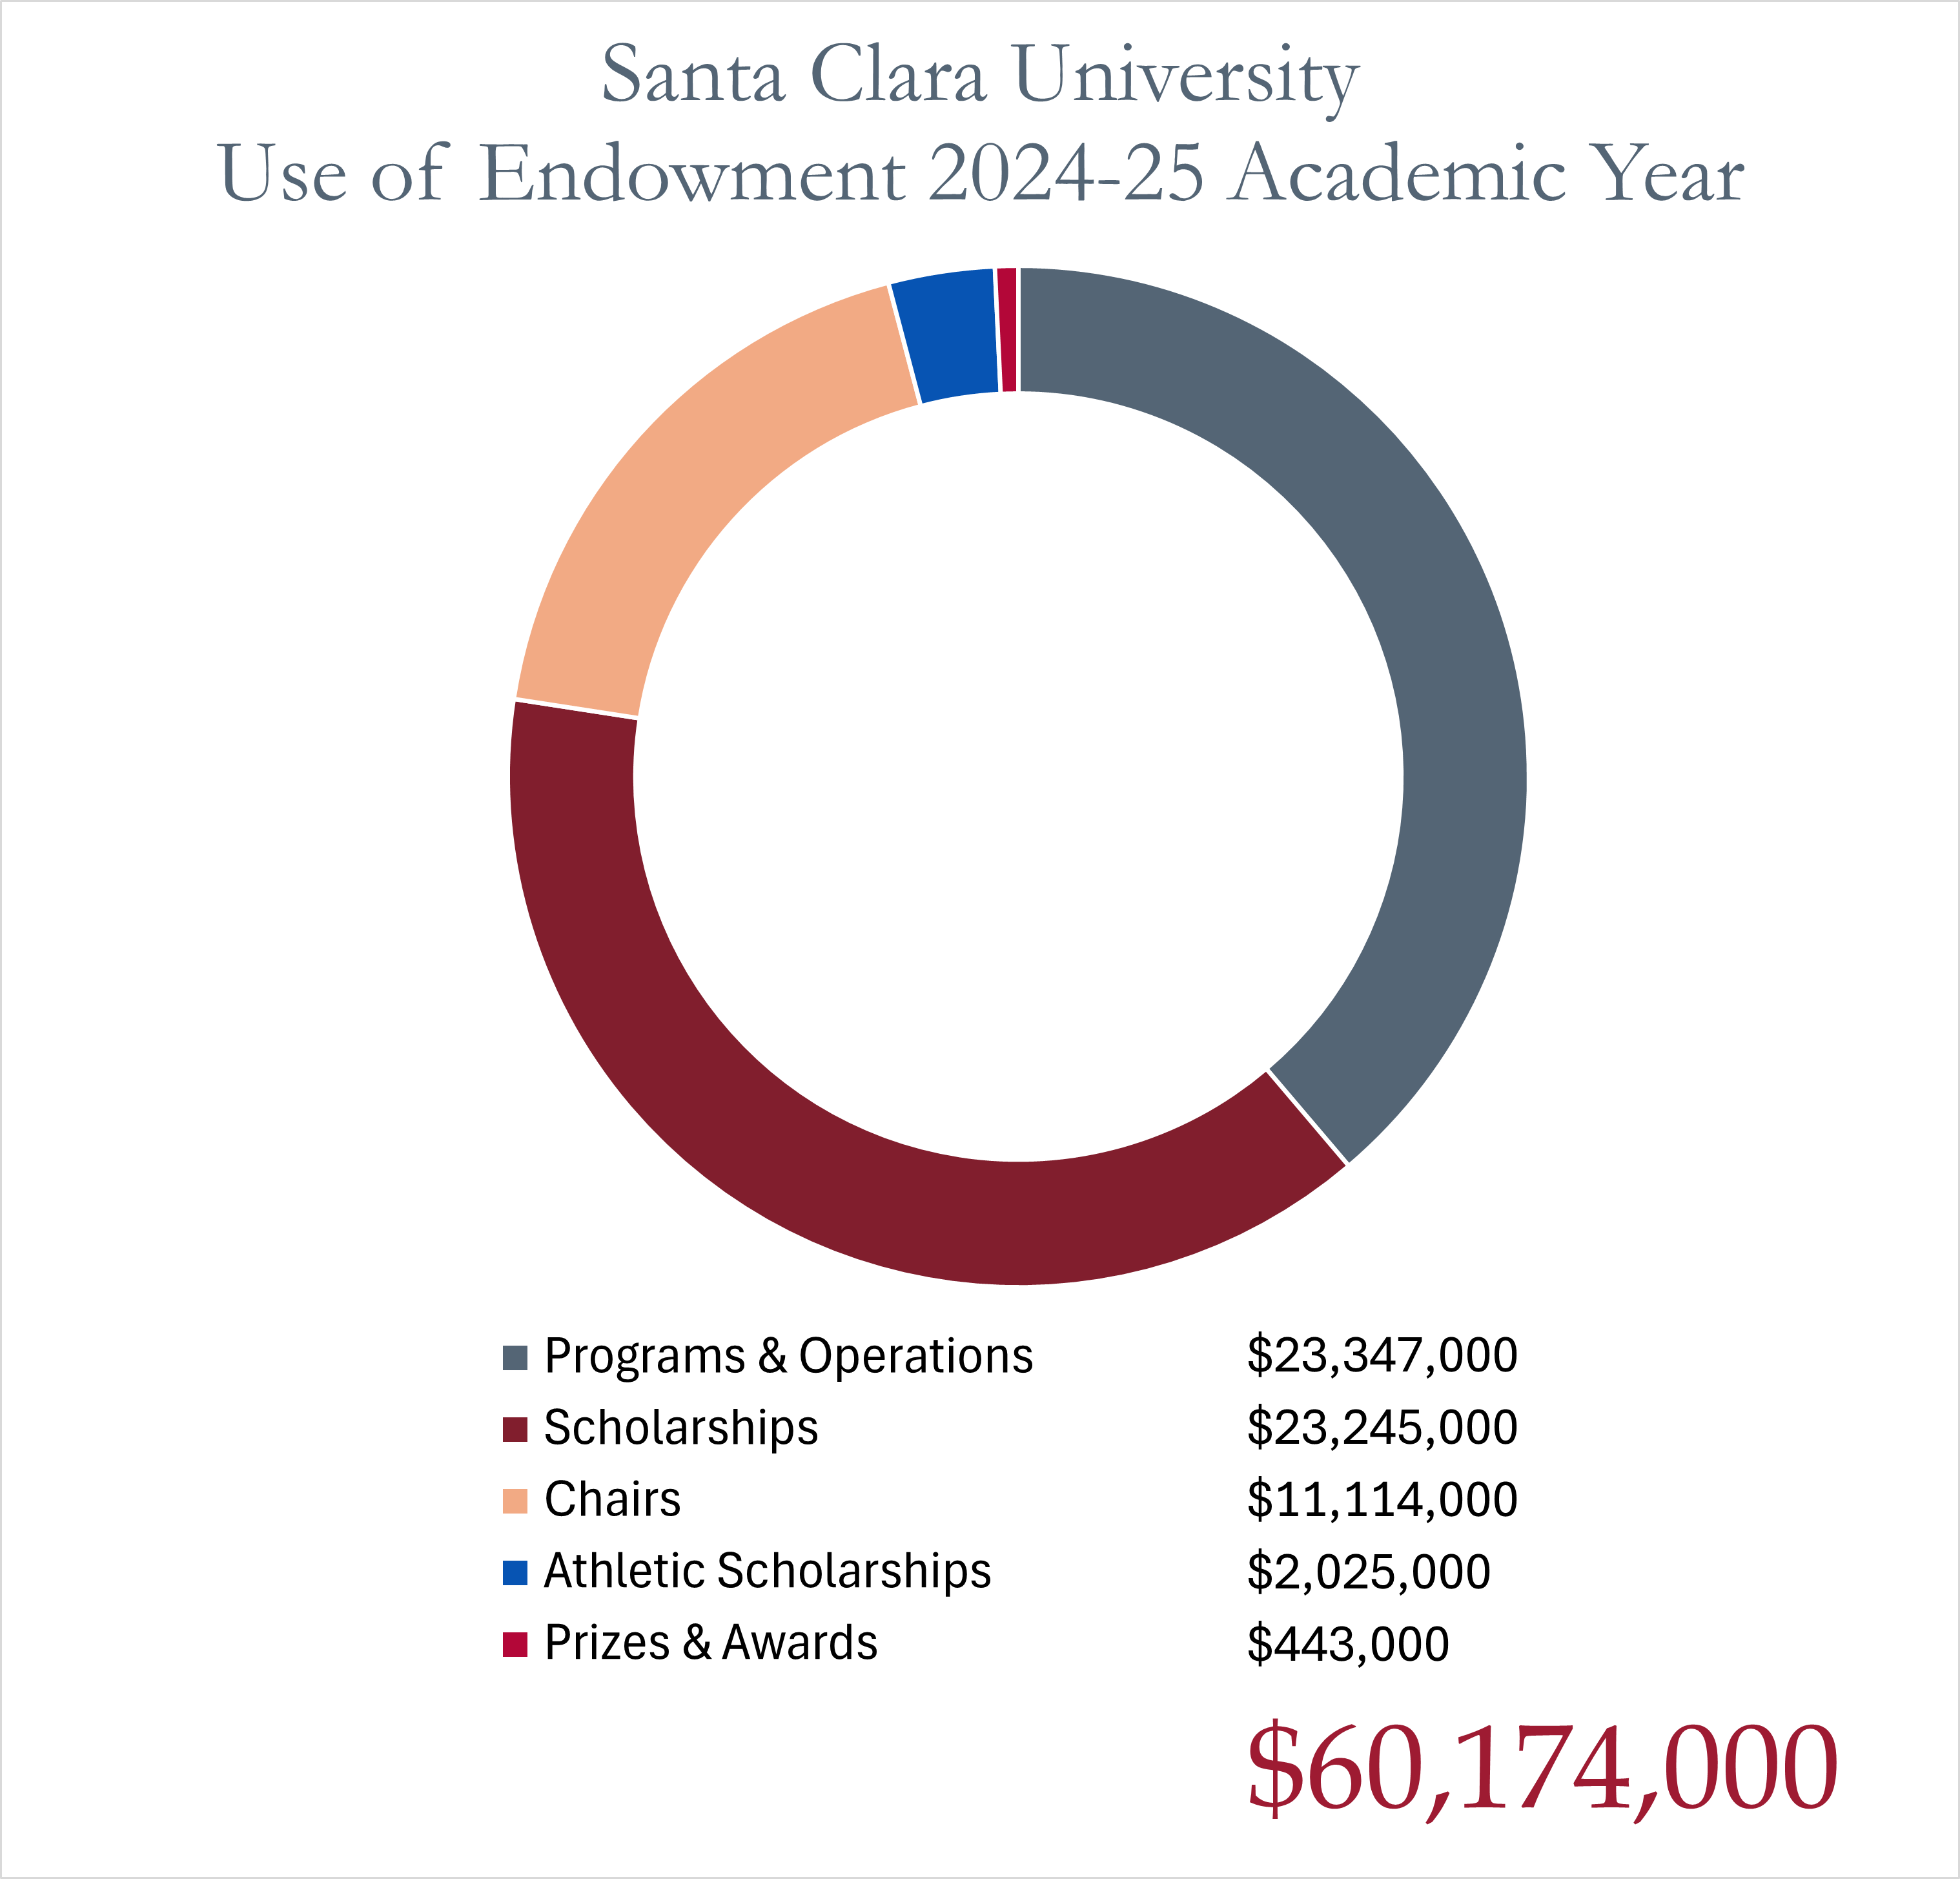
Graph of SCU's use of endowment during the 2024-25 academic year
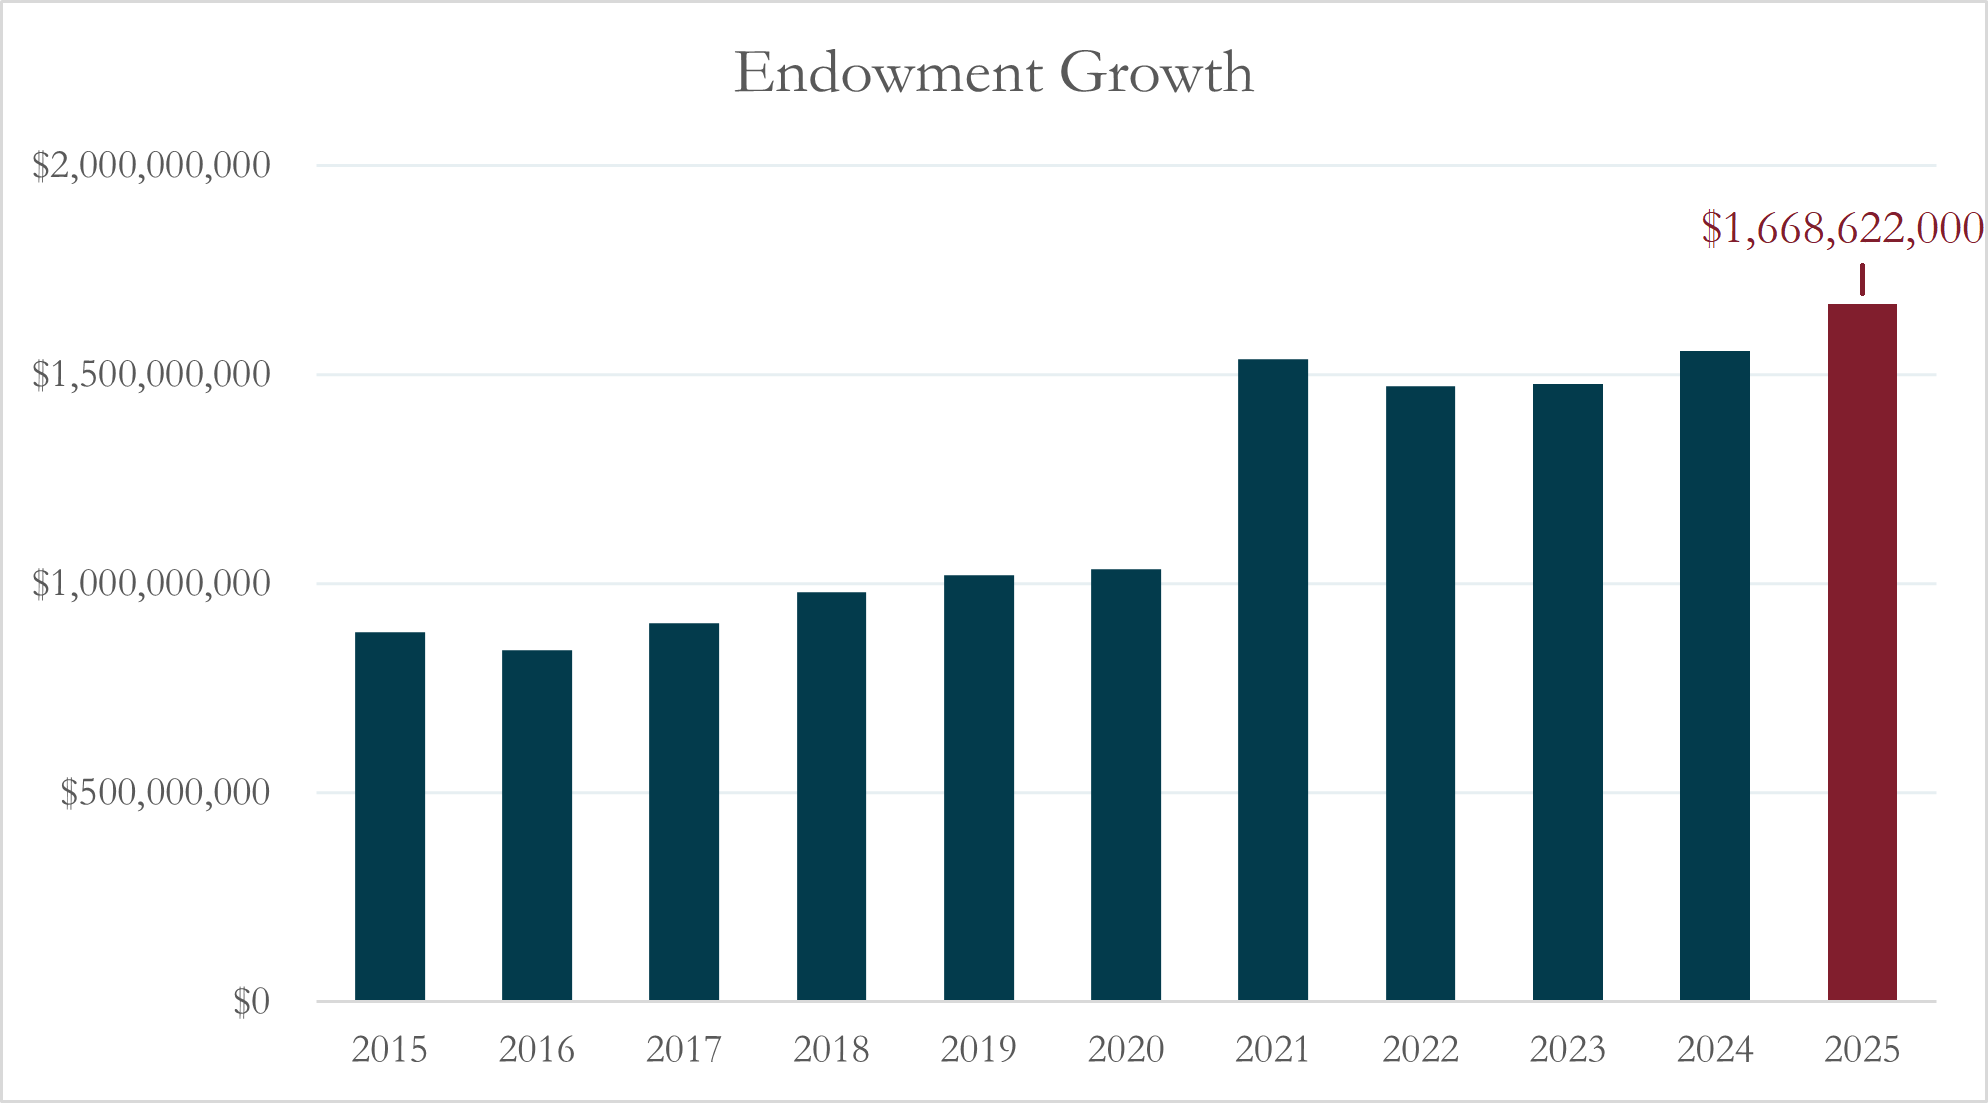
Graph of SCU's endowment growth

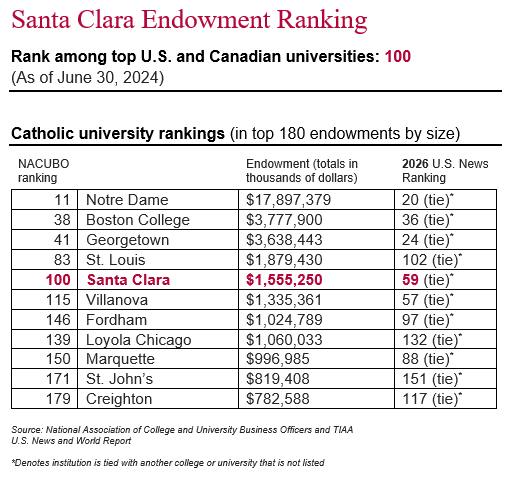
Santa Clara Endowment Ranking

Chart of SCU's endowment ranking among top US and Canadian universities

National Association of College and University Business Officers NACUBO-Commonfund Study of Endowments® (NCSE)

Each year, the National Association of College and University Business Officers (NACUBO) and Commonfund release the NACUBO-Commonfund Study of Endowments® (NCSE), a national benchmark of endowment performance and impact across higher education. The 2024 study includes 658 U.S. colleges and universities and affiliated foundations, representing $873.7 billion in total endowment assets. It also highlights how endowments support core priorities such as student financial aid, academic programs, faculty positions, and campus operations. Participating institutions distributed $30 billion from their endowments during the fiscal year, funding an average of 15.3 percent of annual operating expenses. Santa Clara University’s ranking reflects our reported endowment market value within this national study.


Endowment Overview

  • The Role of the Endowment

    expand_more

    As stewards of the university’s endowment, the Santa Clara Investment Office manages a diversified investment portfolio that provides recurring financial support for key university operations.  The goal is to generate sufficient investment returns so that the portfolio can serve both the needs of current and future generations of university stakeholders.  We refer to this as “intergenerational equity.”

    Underlying the endowment are over 1,000 donor designated pools, each contributing in a unique way to help Santa Clara deliver a world-class Jesuit education.  The largest designations include merit and need-based scholarships, funding for a variety of university programs and endowed chairs to attract prominent faculty.  Every year, the university liquidates approximately 4.5% of the portfolio and contributes the proceeds to fund current operations.  In Fiscal 2025, this has equated to $60 million or 9% of the University’s operating budget. 
     

  • Use of the Endowment

    expand_more

    The past decade has demonstrated the benefit of the endowment model.  Between July 2015 and June 2025, the endowment has contributed an aggregate of $444 million to the university’s operating budget while also compounding the value of the portfolio from $885 million to $1.669 billion.  This growth has helped accomplish the endowment’s goal of ensuring adequate funding for current university programs while also strengthening the university for future generations of Santa Clara students. 

  • Fiscal 2025 Endowment Performance (July 2024 – June 2025)

    expand_more

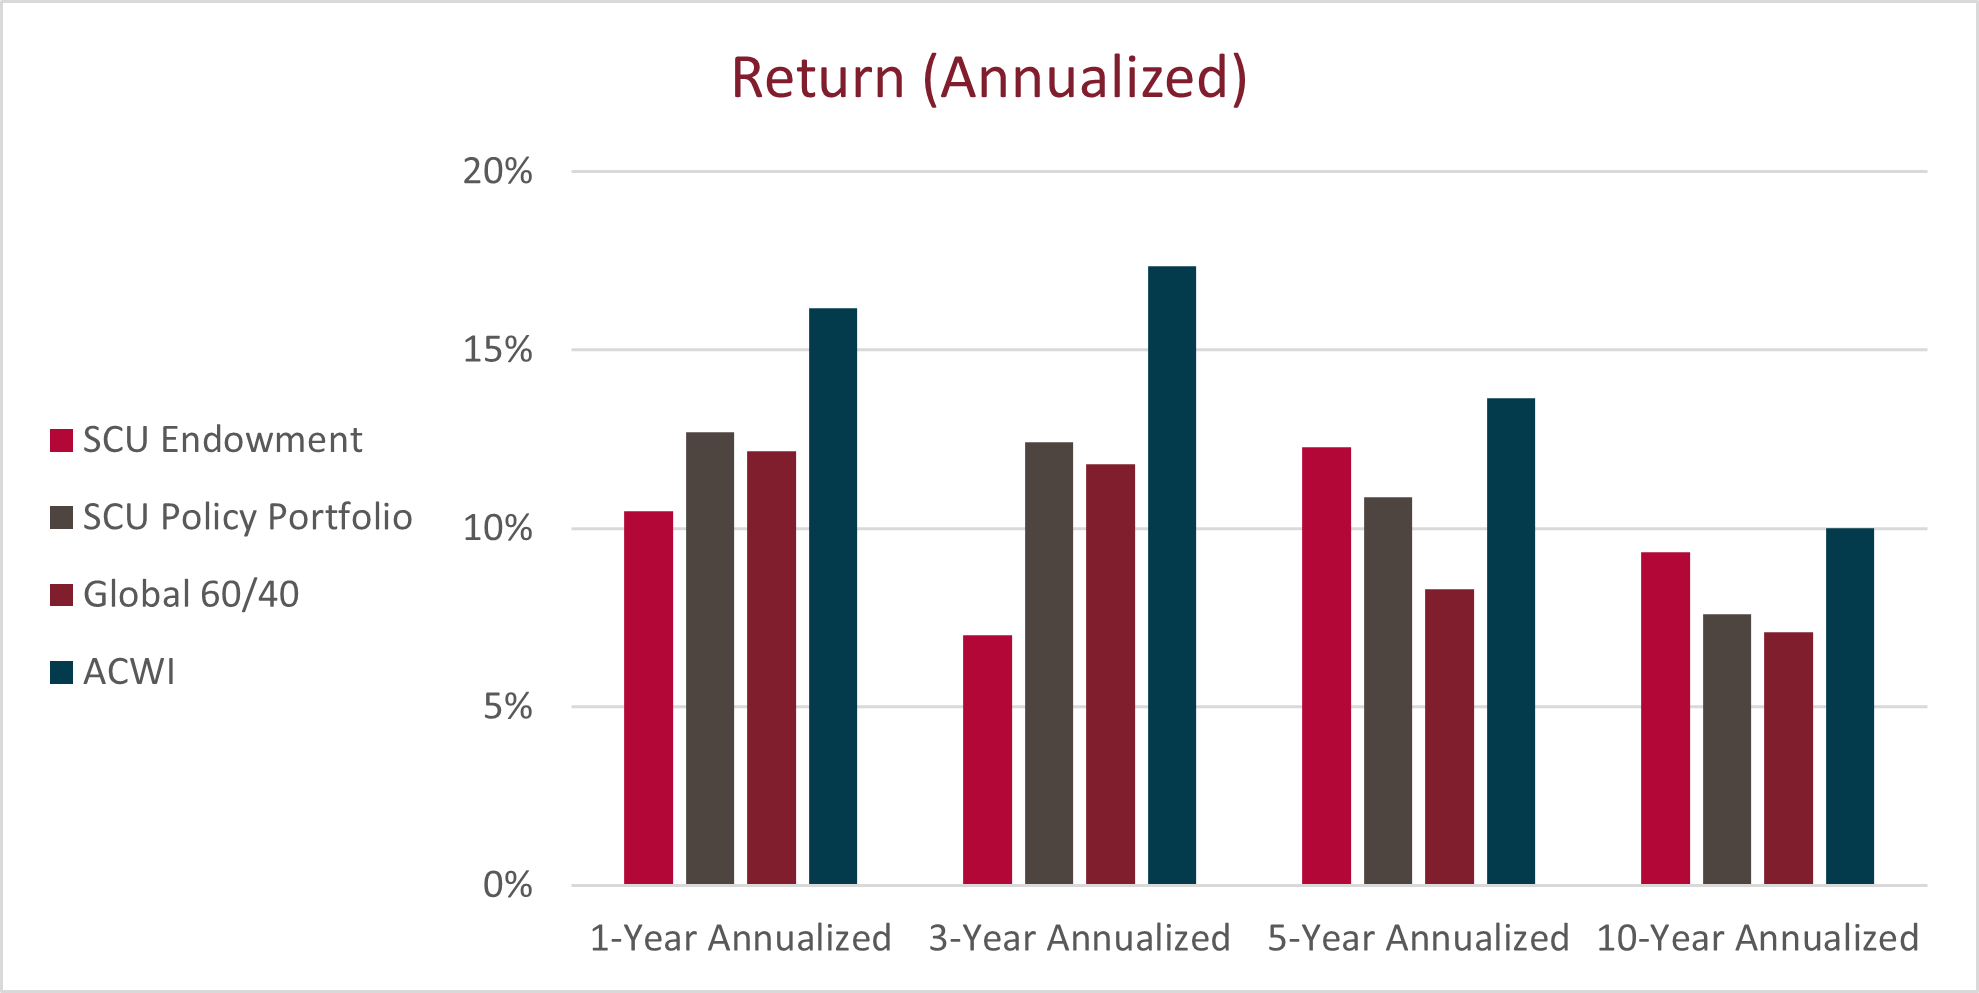
    The Santa Clara endowment returned +10.5% for Fiscal 2025, which trailed the +12.7% return of the policy portfolio. Over the last ten years, the endowment has returned +9.3% annualized, which compares favorably to the +7.6% return of the policy portfolio.  Compared to endowments with greater than $1B in assets, Santa Clara’s endowment exceeded the Fiscal 2025 one-year median return of 10.4%, as measured by Cambridge Associates.

    Frank Tessier, Santa Clara’s Chief Investment Officer noted, “We are pleased with the investment results of the SCU Endowment over the past year, with the performance just surpassing the median of our peer institutions. It is normal for the endowment to occasionally underperform its policy portfolio over shorter time horizons, as we focus on long-term returns and outperformance over a full market cycle. However, we are not satisfied; while the endowment remains strong, we are constantly striving to improve it, adding world-class managers and assets, and evolving the portfolio as the market changes.”

    The Investment Office remains keenly focused on risk management to ensure that the portfolio is safe in most any economic environment. The endowment retains a healthy posture, with an appropriate mix of diversification among return-generating assets and defensive liquidity. 

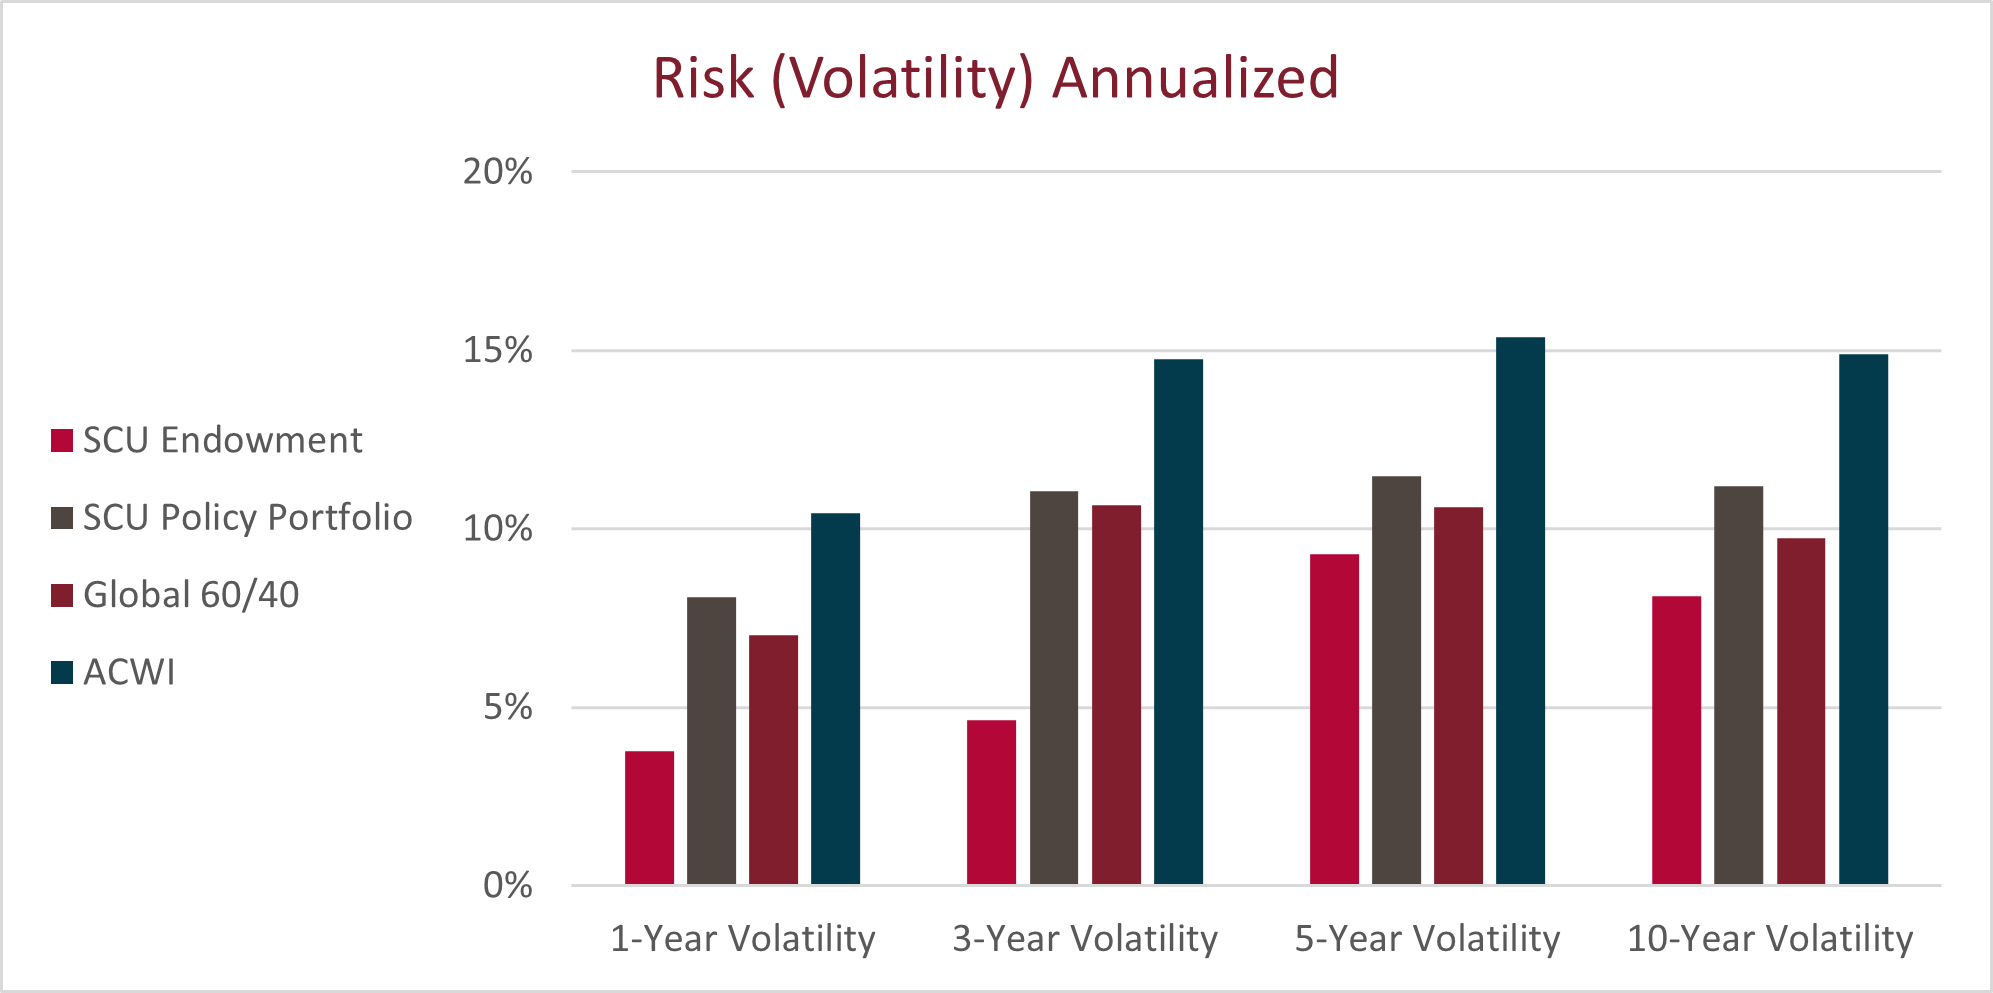
The charts below compare the levels of return and risk (volatility) of the University’s endowment, its Policy Portfolio, a blended portfolio of 60% global stocks/40% bonds and the MSCI All Country World Index (ACWI). Risk here is defined as volatility, or standard deviation. In general, higher volatility means higher risk because volatility directly measures the historical range of outcomes and is a good predictor for the range of future potential outcomes.

Risk & Return Summary (as of June 30, 2025)

Graph of SCU's returns annualized
Graph of SCU's risk annualized

500 El Camino Real • Santa Clara, CA 95053 
www.scu.edu | [email protected]